
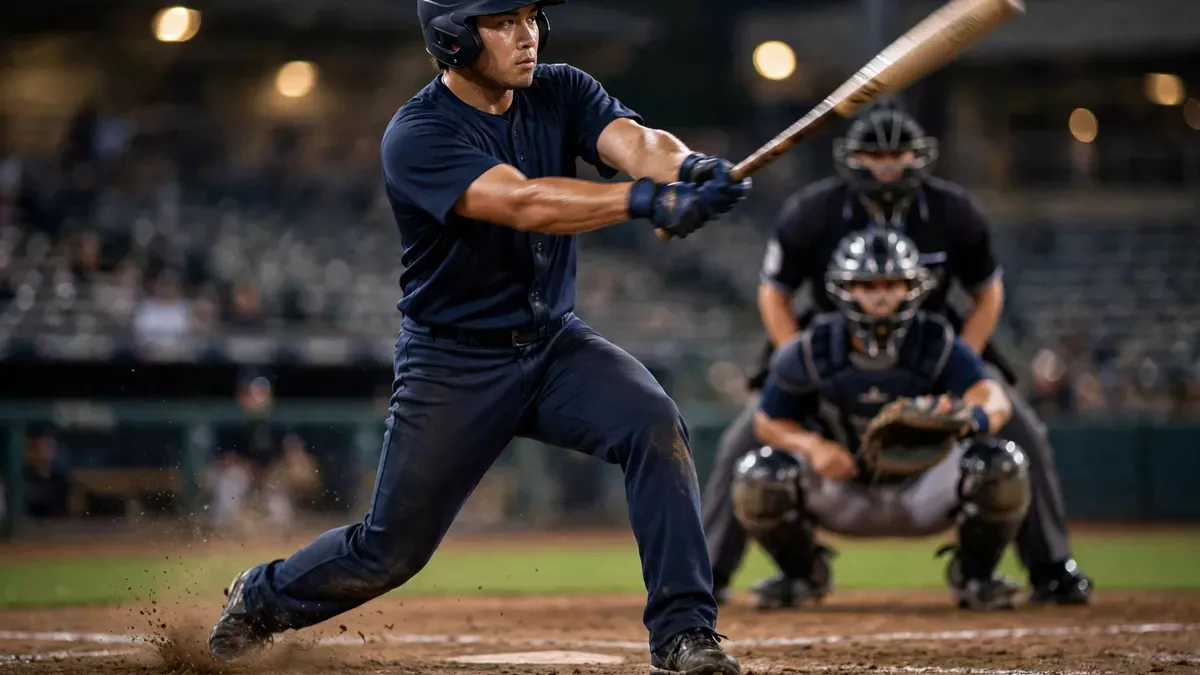
Baseball stats fall into three generations: the classic line (batting average, home runs, RBIs, wins, ERA), the on-base revolution (OBP, slugging, OPS), and the modern value era (WAR, OPS+, WHIP, FIP and Statcast measurements like exit velocity). The single most useful shortcut: judge hitters by OPS — how often they get on base, plus how much power they hit for — and translate everything else against league average, where 100 is exactly average for the indexed stats.
This guide explains the numbers that actually matter, what each one measures, what a good mark looks like, and where each stat misleads — so the next broadcast graphic or box score reads like a story instead of a spreadsheet.
Key Takeaways
- OPS = on-base percentage + slugging percentage: the quickest single measure of a hitter.
- OBP matters more than batting average because avoiding outs is the hitter’s first job.
- OPS+ and wRC+ index performance to league average: 100 is average, 120 is 20 percent better.
- WAR estimates a player’s total value in wins; 2 WAR is a solid regular, 5 is an All-Star, 8-plus is an MVP season.
- ERA can mislead; WHIP and strikeout-to-walk numbers show how a pitcher is really performing.
- Statcast numbers (exit velocity, launch angle, sprint speed) measure the ingredients, not the results.
The classic line, and its limits
For a century, a hitter was summed up by the Triple Crown categories: batting average, home runs and runs batted in. Two of the three survive scrutiny. Home runs are self-evidently valuable. Batting average and RBIs, though, carry famous flaws.
Batting average (AVG) counts hits per at-bat — and ignores walks entirely. A hitter who walks 100 times a year creates enormous value that batting average scores as zero, while treating a walk and a strikeout as identical failures. League averages typically sit around .250, with .300 marking excellence.
Runs batted in (RBI) depend on teammates. An ordinary hitter batting behind two on-base machines will collect RBIs a better hitter on a weak team never gets the chance to match. RBIs measure opportunity and outcome mixed together, which is why modern analysis treats them as context, not skill.
Wins for a pitcher are the most misleading classic stat of all: a starter can allow one run, lose 1–0, and get nothing, or allow six runs, win 9–6, and get the credit. Analysis has largely retired the pitcher win as a quality measure, even though it remains in the record books and in the record of the game’s history.
The on-base revolution: OBP, SLG and OPS
The correction began with a simple insight: the scarcest resource in baseball is the out, and the hitter’s first job is not to make one.
On-base percentage (OBP) measures how often a batter reaches base per plate appearance — hits, walks and hit-by-pitches all count. League average sits around .320, and the best on-base players reach .400. OBP is the foundation of modern lineup construction; the leadoff spot now belongs to a high-OBP hitter rather than simply a fast one.
Slugging percentage (SLG) measures total bases per at-bat: a single is 1, a double 2, a triple 3, a home run 4. It is not actually a percentage — a perfect mark would be 4.000 — but a power gauge, with league average near .410 and elite sluggers above .550.
OPS simply adds them: OBP + SLG. It is crude arithmetic — the two parts have different scales, and the sum slightly undervalues the on-base half — but as a one-number summary of a hitter it is unmatched for convenience. As a rule of thumb: .800 is a good hitter, .900 is a star, and 1.000 is a season for the ages.
Indexed stats: OPS+ and wRC+
Raw OPS cannot compare across eras or ballparks — a .850 OPS in a pitcher’s park in 1968 means something different from the same line in a hitter’s park in 2000. Indexed stats solve this by setting league average to 100 and adjusting for park effects.
OPS+ (and its close cousin wRC+, which uses a more sophisticated run-creation formula) expresses a hitter as a percentage of league average. A 120 OPS+ hitter produced offense 20 percent better than average after adjustments; an 85 was 15 percent worse. This is the fastest way to answer “how good is he, really?” across generations — and why a modern .260 hitter in a dead-ball environment can grade out above a .300 hitter from a high-offense era.
WAR: the one-number answer, with fine print
WAR — Wins Above Replacement — attempts the most ambitious thing in sports statistics: estimate how many more wins a player is worth than a freely available fill-in (“replacement level”: a minor-league call-up or waiver claim).
It combines hitting, baserunning, fielding and — for pitchers — run prevention, adjusts for position and park, and returns one number. The rough scale every fan should know:
- 0 WAR: replacement level — the freely available baseline.
- 2 WAR: a solid everyday regular.
- 5 WAR: an All-Star-caliber season.
- 8 WAR and above: an MVP-caliber season.
Two cautions belong with it. First, there are two major public versions — Baseball-Reference’s and FanGraphs’ — which differ, especially in how they value pitchers and defense, so a player’s “WAR” without a source is an incomplete citation. Second, WAR is a measuring stick, not a verdict: it is the best starting point in any “who was better” argument, not the end of one. MVP voters, front offices and analysts all use it exactly that way.
Pitching beyond ERA
ERA (earned run average) — earned runs allowed per nine innings — remains the headline pitching stat, and within a season it is a fair summary: league average hovers around 4.00, aces live under 3.00. Its weakness is credit assignment: ERA depends on the defense behind the pitcher, the ballpark, and the official scorer’s judgment about errors, and a reliever can be charged for runs set up by the pitcher he replaced.
The supporting cast fixes most of the blind spots:
- WHIP (walks plus hits per inning pitched) shows how much traffic a pitcher allows — 1.00 is excellent, 1.30 is average-ish, 1.50 is trouble.
- Strikeout rate and walk rate (K%, BB%, or per-nine versions) are the purest skills: strikeouts are the one out a pitcher earns almost alone, and walks are the one failure fully his.
- FIP (Fielding Independent Pitching) estimates what a pitcher’s ERA “should” be from only strikeouts, walks, hit batters and home runs — the outcomes the defense cannot influence. A pitcher whose FIP is far below his ERA is usually pitching better than his results, and vice versa.
- ERA+ indexes ERA to league and park like OPS+ does for hitters: 100 is average, and for pitchers, higher is still better.
The Statcast layer: measuring the ingredients
Since 2015, radar and camera systems in every ballpark have tracked the physical inputs of the game, and the vocabulary has entered everyday broadcasts.
Exit velocity is the speed of the ball off the bat; launch angle is its vertical trajectory. Together they define the modern ideal — a “barrel,” the hardest-hit balls at the angles where extra-base hits live, roughly the high-80s mph and up combined with launch angles in the teens and twenties. A hitter’s average exit velocity and barrel rate are the closest thing baseball has to a fuel gauge: results fluctuate, but hit the ball hard at good angles and the hits eventually follow.
Pitching’s equivalents include spin rate, velocity, whiff rate (swings and misses per swing) and chase rate (how often hitters pursue pitches outside the zone). On the bases and in the field, sprint speed and outs above average do similar work for defense. The important mental shift: these are process stats. They predict better than they describe, which is why front offices trust them over a month of lucky or unlucky results.
The traps: small samples, ballparks and luck
Even the right stats will lie to you if you feed them the wrong context. Three traps catch fans every season.
Sample size. Baseball stats stabilize at very different speeds. Strikeout and walk rates settle within weeks; batting average on balls in play can wander for a full season. A hitter’s .380 April almost never means what it appears to mean, and a pitcher’s 7.00 ERA across three starts is noise more often than news. Process stats — swing decisions, exit velocity, pitch quality — become trustworthy first, which is why analysts lean on them hardest in April and May.
Ballparks. Not all .300 seasons are equal because not all parks are equal: altitude and short outfield porches inflate offense, big coastal parks suppress it, and the adjustments inside OPS+ and WAR exist precisely to launder these differences out. When a player changes teams and his raw numbers jump or crater, check the parks before declaring a breakout or a collapse.
Luck on balls in play. The share of a hitter’s balls in play that fall for hits (BABIP) averages around .300 and is heavily luck-driven in short stretches — line drives find gloves, bloopers find grass. A star hitting .210 with a .240 BABIP and his usual exit velocities is usually a buy-low candidate, not a player in decline; a journeyman hitting .340 on a .390 BABIP is usually the reverse. The stats do not remove fortune from baseball, but they let you see it coming and going.
The honest summary of the whole analytics era is modest, and it is why both the old line and the new numbers still appear on your screen: counting stats tell you what happened, rate stats tell you how well, indexed stats tell you compared with whom, and process stats tell you what is likely to happen next. A complete fan reads all four layers — and knows which layer any single number belongs to.
How to read a line like a scout
Put it together and the modern box-score read takes seconds. For any hitter, start with OBP and SLG (or just OPS, ideally OPS+): does he avoid outs, and does he drive the ball? Add WAR for the full picture across a season. For any pitcher, start with ERA for the record, then check WHIP and the strikeout-to-walk relationship for the truth underneath, and FIP for what comes next. Then glance at the Statcast line — exit velocity allowed, barrels — to see whether the results are built on skill or on fortune.
That sequence will carry you through almost any broadcast argument, fantasy decision, or Hall of Fame debate — including the debates our MLB hub (/mlb/) runs all season, and it pairs well with our guide to how the MLB playoffs work (/how-the-mlb-playoffs-work-wild-cards-division-series-and-the-world-series/), where these numbers shrink to their smallest, loudest samples.
Baseball stats FAQ
What is a good OPS?
Around .800 marks a good hitter, .900 a star, and 1.000 a historic season. League average is typically in the low .700s.
Is OBP or batting average more important?
OBP. It counts walks as the successes they are, and avoiding outs correlates more strongly with scoring runs than hits per at-bat does.
What does WAR actually mean?
An estimate of how many wins a player adds compared with a freely available replacement player — combining batting, baserunning, fielding (or pitching) and positional value.
What is a good ERA and WHIP?
An ERA under 3.00 is excellent (league average is near 4.00); a WHIP near 1.00 is excellent, and above 1.40 usually signals trouble.
Why do two sites show different WAR for the same player?
Baseball-Reference and FanGraphs calculate it differently — most notably for pitchers and defensive value. Always note which version is being quoted.
What is OPS+?
OPS adjusted for league and ballpark, indexed so 100 is exactly league average; 120 means 20 percent better than average.
Related reading
Put the numbers to work in October with our guide to how the MLB playoffs work (/how-the-mlb-playoffs-work-wild-cards-division-series-and-the-world-series/), follow the season on our MLB hub (/mlb/), and watch the races take shape on the MLB standings page (/mlb/standings/).
Corrections: if you spot an error in this guide, tell us through our Corrections Policy (/corrections-policy/) page and we will check it against official sources.